PFI is shown here in the wrapper-method context of Raschka’s lecture.
The permutation experiment
Shuffle one input. Evaluate the same model.
Symbolic rows · mechanism only
Original age column
Symbolic rows, not patient records. Age and low oxygen are shuffled separately; original inputs are restored before each experiment.
Row
Age aᵢ
Low oxygen
Observed outcome
Original f(xᵢ)
Permuted f(xᵢ perm)
Schematic symbols, not patients: aᵢ = age; oᵢ = low oxygen; yᵢ = target. f(·) denotes a model prediction. No row-level probabilities or outcomes are displayed.
One column at a time
Evaluate the original inputs
Original inputs
Same trained modelXGBoost · parameters fixed
Compare predictions with the same outcomes
Full study test set · Brier score · lower is better
The original error is the reference. The second error follows the age permutation.
Schematic operation and measured results
The model, records and outcomes stay fixed. Only the age values move between rows.
From error to importance
Permutation Feature Importance in our SRAG model
Most important inputs
Building the ranking…
Same model and records in every permutation.
Molnar · the same experiment
How much did the error change?
Difference
Extra error in the metric’s own units. 0 means no change.
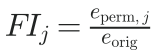
Ratio
Error as a multiple of the original. 1 means no change. Above 1: more error. Below 1: less error.
Age in the SRAG experiment
Original Brier
After permutation, mean
Difference: the extra Brier error. Zero means no change. The ranking stays the same because every feature shares the same original error.
Study details and numerical evidence
The whiskers show variation across column shuffles, conditional on this fitted model and evaluation set. They are not population confidence intervals. The Brier score averages squared differences between predicted death probabilities and observed outcomes.
This is permutation importance for predictive performance. It does not establish a causal effect of a variable on death. Ratios below 1 are possible when shuffling reduces the error; 1 is a reference, not a lower bound. The top-ranked features shown here all increase mean error.
The motion replays the recorded Python results. Each full-test shuffle uses the same fitted model, outcomes and evaluation rows. The compact table is a symbolic mechanism diagram, without patient values.